![]()
- Introduction
- Consortium
- Description
- 3D Mapping
![]()
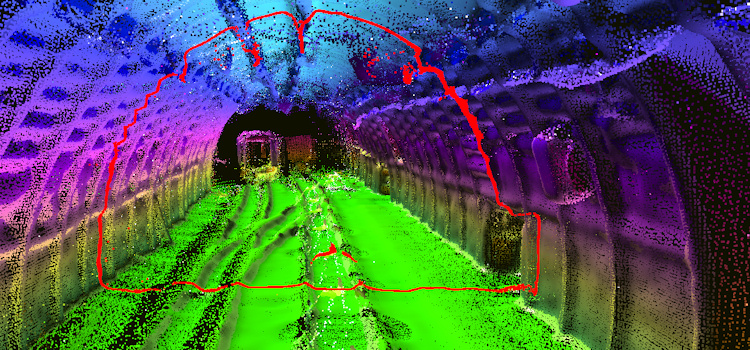
This subsystem is primarily intended for 3D map building during robot movement in coal mine route. By the help of this 3D map can rescuers plan their possible intervention in detail. The second use of this subsystem is to provide real-time information about robot surroundings for the autonomy control (in the case of losing communication with operator). The methodology for point cloud registration was developed and tested on data acquired in the coal mine Queen Luiza in Gliwice (Poland), where was scanned about 360 meters of tunnels. An average number of points in every cloud was about 200,000; clouds were obtained in approximate distances 2 m in one direction of the coal mine route; the total number of points in the merged point cloud after filtering is 32 million.
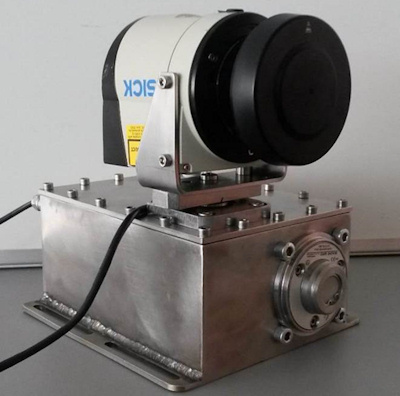
3D Lidar developed for the TeleRescuer project
As the goal of the TeleRescuer project is to provide "virtual teleportation" of a human rescuer into the sealed mine, the 3D map should be presented to the operator in a clear and illustrative way to allow him to inspect all important parameters in real time. It also should integrate important sensor readings and similar data into the point cloud.
The best solution was to create a custom graphical engine tailored to the needs of this project. The engine is implemented in C++ and uses the Direct3D 11.0 graphical API for hardware graphic acceleration of many complex calculations related to rendering.
The visualisation software uses some performance optimisations to allow fast real-time display of tens of millions of points. These optimisations include Octree system that divides points into cube nodes and some algorithms executed on the nodes to lower the actual number of processed and rendered points to the necessary minimum. The algorithms include for example view frustum culling and level of detail.
Video demonstration of the basic functions of the visualization software
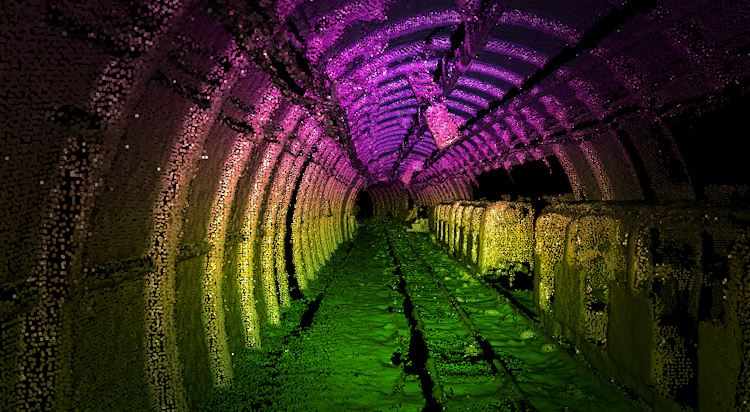
A typical render output of the point cloud visualization software
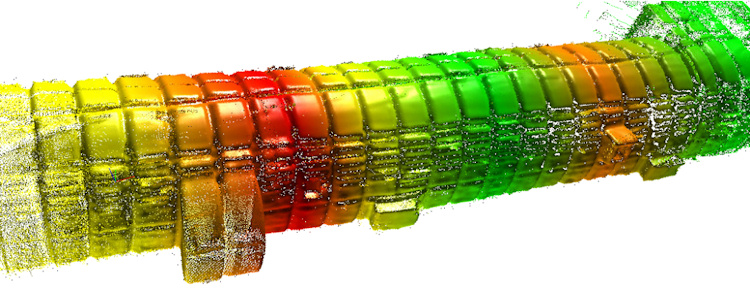
Using colour gradient to visualise sensor readings (temperature) in a tunnel
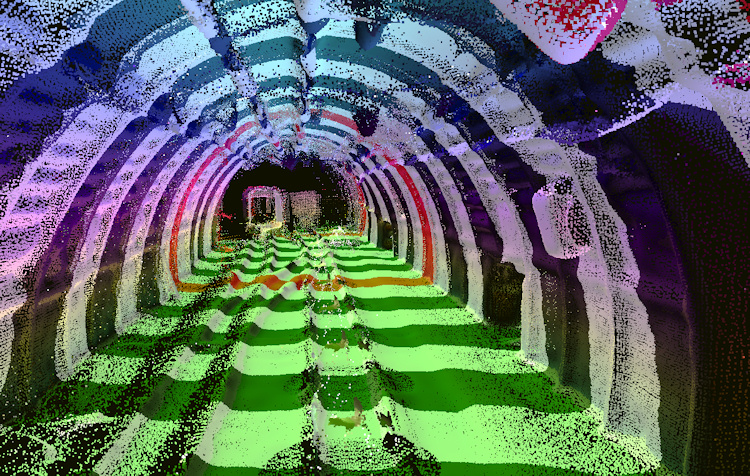
Tunnel cross-section
Distance measuring matrix
The project has been carried out in a framework of an EU programme of the Research fund for Coal and Steel under the grant agreement No. RFCR-CT-2014-00002 and by Polish Ministry for Science and Higher Education from financial sources that constitute the public aid in years 2014-2017 as-signed for an accomplishment of an international co-financed project.
Official TeleRescuer web presentation (www.telerescuer.polsl.pl)